CADS Embodied carbon is a program for estimating the embodied carbon quantities for different structural schemes.
The calculations are based on the recent guidance published by The Institution of Structural Engineers, How to Calculate Embodied Carbon (IStructE, 2020). The carbon quantities may be estimated at different stages of the design process by creating separate schemes for each stage. It is also possible to make alternative schemes for the same project to compare the carbon quantities across these different proposals so that the most environment friendly scheme may be chosen.

Input Options
The site address is entered using Google Maps, via a postcode or it can be manually entered.
Select the project stage and type from a list of preset variables, the design life. The program uses the life cycle stages as defined in BS EN 15978- 2011.
This application allows you to specify the schemes, their properties, additional carbon quantities and the bill of materials for each scheme.
Depending on the purpose, you can choose to calculate the embodied carbon for some or all of the life cycle stages.
You can create and evaluate multiple schemes using this application.
The user can specify the bill of materials for each scheme.
Output
The application works by fetching carbon factors associated with the materials you enter in the bill of materials.
This version of the application uses the carbon database found in The Inventory of Carbon and Energy (ICE), Building Services Research and information Association (BSRIA).
You can select the more commonly used materials and group them into a shorter list in the Preferred database for easy access. You can also add new materials to create your own database.
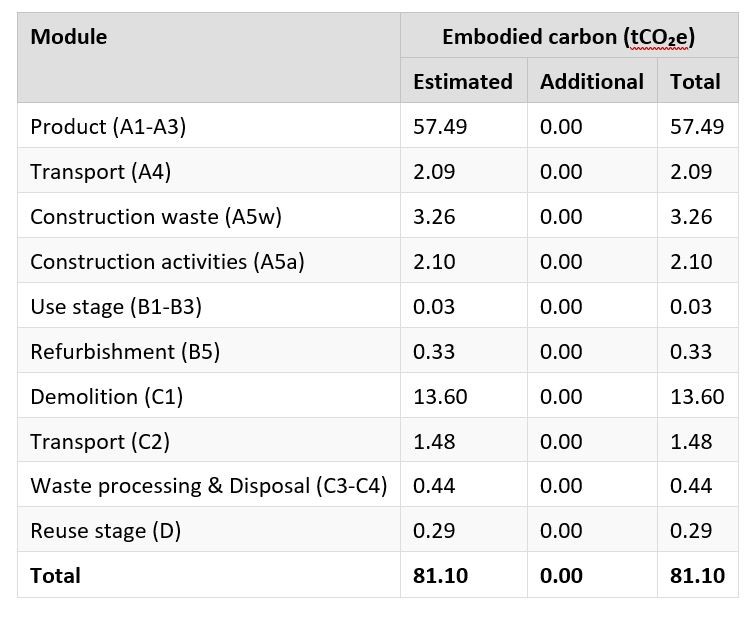
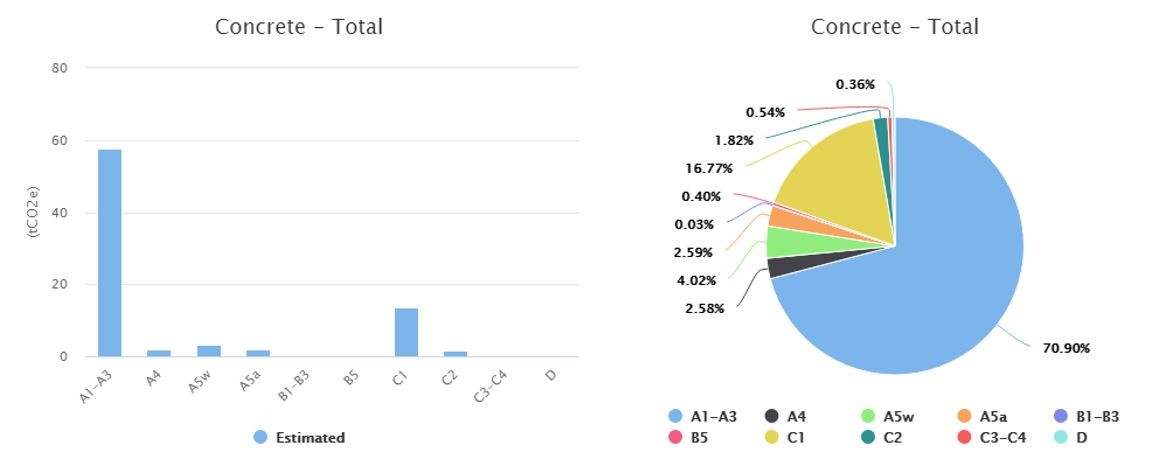
The estimated carbon from all the materials entered in the bill of quantities are plotted in different graphs and displayed under this tab. The Results graphs tab can display the graphical output for individual schemes or display comparison graphs across the different schemes. For each scheme, a collection of bar and pie charts showing the split of the carbon between the different material types, sections and life cycle stages.
For each scheme, a collection of bar and pie charts showing the split of the carbon between the different material types, sections and life cycle stages.

Discover the rest of our design applications and associated costs with CADS Hub


